
Greater Seattle House Price & Appreciation
The second project is about applying the knowledge that we learned about linear regression.
Why this topic?
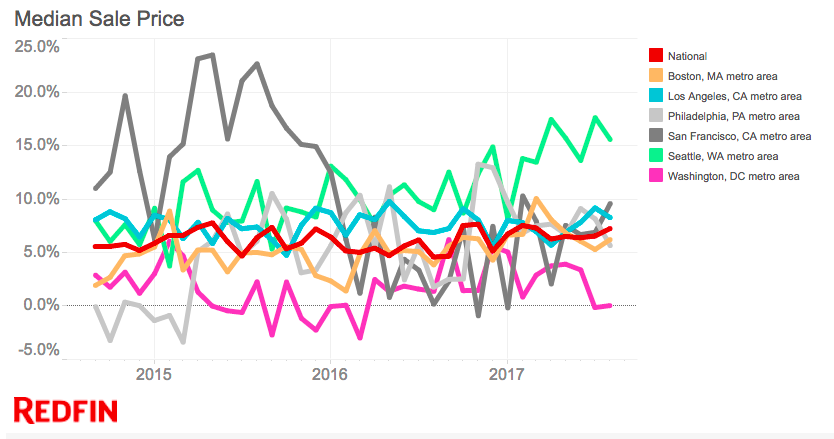
My husband and I recently moved to Seattle. Last year, when we started to search for our new home, we had a hard time comparing different properties and decide how high we should reasonably go for a offer in this competitive market. Also,as you could see from below chart which shows the annual percentage increase of median house price, Seattle area has become one of the fastest appreciating metro areas among the nation. There could be good opportunites for real estate investors. These drive me to create a model that could predict property price/appreciation which would help home buyers and investor make better decisions.
Data Source and size
Using selenium and beautiful soup, I scraped my data from www.redfin.com for all properties sold in the past 3 months in the city of n Seattle, Kirkland, Bellevue and Redmond.
- Data Size:
- 4290 data points (Price)
- 2895 data points (Annual Appreciation)
- Features:
- 8 Numeric ones:$/Square feet, # of Baths, # of Beds, HOA/Month, Square feet, School Avg Rating, Year Built, Lot size
- 2 Categorical ones: Property Type, Zip Code
Modeling steps
- Eliminate outliers & transform skewed data
- Standardized numeric features
- Generate dummy variables for categorical features
- Perform k fold cross validation and select key features based on p values
- Increase polynomial degree of the key features
- Use cross validation to determine the ideal alpha value in regulation tool (Lasso, Ridge) to minimize test error
Results and findings
Price Model
- Result of Lasso 3-fold cross validation:
- Polynomial degree = 2
- Alpha: 1e-8
- Train R^2: 0.83
- Train SSE: 0.046
- Test R^2: 0.79
- Test SSE: 0.055
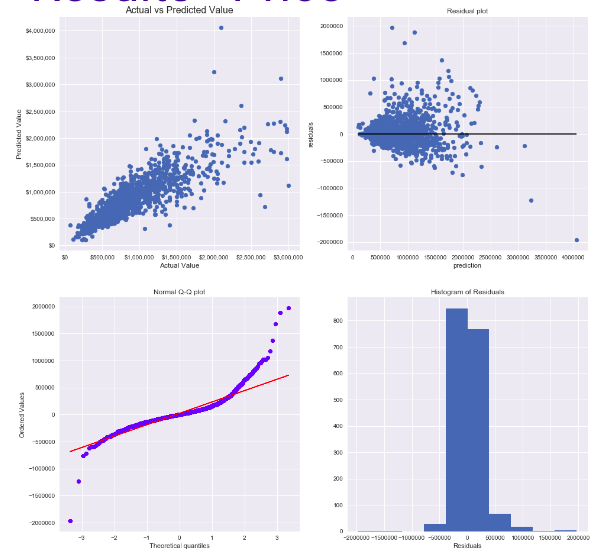
- Findings: As we could see from the residual plot, the model tend to predict too low for the lower price house and too high for the higher price house. This first may due to that I only have 100 data points out of 4290 for house above 2 million. So more data points of higher house price need to included to refine the model. Also, it might be a good idea to have two individual models to predict house in lower/higher range.
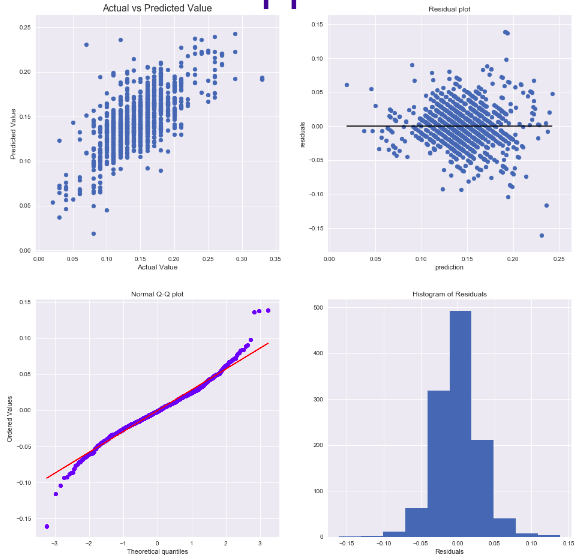
Appreciation Model
- Result of Lasso 3-fold cross validation:
- Polynomial degree = 2
- Alpha: 1e-8
- Train R^2: 0.57
- Train SSE: 0.00072
- Test R^2: 0.49
- Test SSE: 0.00085
- Findings:
-
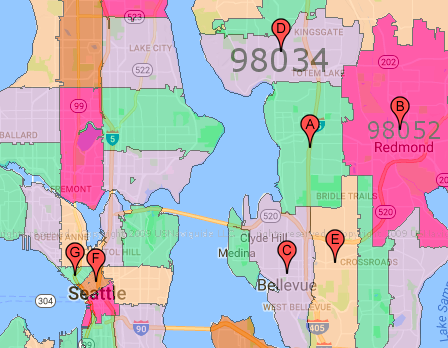
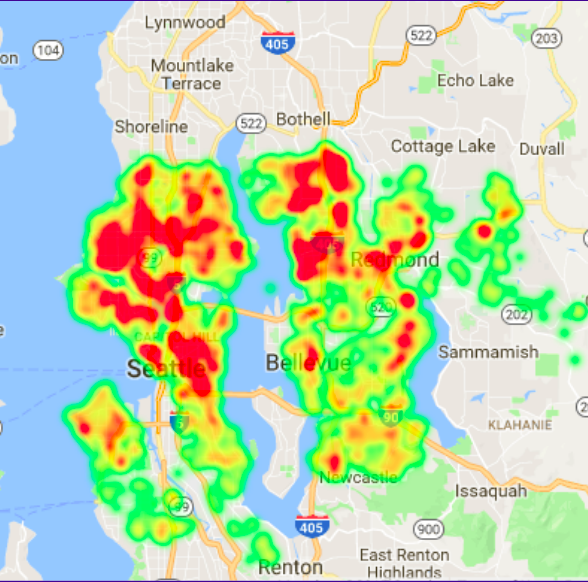
Appreication is strongly dominated by Zip code: The features that have biggest positive/negative coefficent in the appreciation model aligned with the zip codes with the top/bottom average annual appreciation. Below map shows the top 5 (A-E) and the bottom 2 zip codes(G & F) in terms of average annual appreciaton. It’s interesting to see that the top ones are all on the east side close to Lake Washington, while the bottom 2 is the Pike Market area. Also find a heatmap for the area regards to annual appreciation in this data set.
-
Numeric features has different effects in different zip codes: For example, based on the coefficents in my final model, being a single family home will increase the appreciation by 2.1%. Being a home in zip code 98126 will decrease my appreciation prediction by 2.6% Yet, being a Single family home in zip code 98126 will increase the prediction by 8.6%.
-
Additional Works
For future works, I would like to first further refine my model by collecting more data and identify more featues. Second, I would like to perform renting vs buying benefit analysis and ROI (return on investment) so that home buyer/investor can easily compare two properties in terms of their financial values. In order to do that, I will incorporate renting information (e.g., average rent in the closeby area), mortgage rate, tax, maintenance expense into consideration.
Leasons Learned
I have learned a lot throughout this process.There’s been road blocks and several back and forths. Here’s some of big take-aways.
-
Explore more data sources early on: I have found interesting websites later in the project when it becomes too late to include these features. So next time, I will give myself enough time for exploring different sources instead of jump right into the project.
-
It’s better to scrape more, rather than less, data than you need: For this project, I would need to open up 4000+ pages to scrape the data. This could take a full day or even longer. There has been a few times that it came to me that I could have scraped some other features as well. And this whole process would have to be restarted again.:weary:
-
Add time delay and error handling exception while doing data scraping: It take time for the website to open up. And I notice some data scraping code was executed before the website fully opens up. This cause some lost to the data. Adding time delay can usually solve this. However, adding long delay time increase the duration of data scraping cycle. Another compromise solution is to scrape the most features last so that they won’t be ‘skipped’.
-
Create functions to make the code clean: Creating functions make code easier to read and more organized. I found this especially helpful in this project as I have been trying different things to improve the model. Without the packed function, sometimes the intermediate varibables got changed unexpected and it cost me a lot of time to rectify to problem and start over.
-
Don’t give up too early: My appreciation model hasn’t been giving a good R square score. But it didn’t prevent me from finding interesting discoveries.