
US Mass Shooting
Why this topic?
The unfortunate event occurred in Las Vegas early this month shocked the US and has become the deadlist mass shooting in the modern US history. I also learned that from 1966 to 2012, nearly ⅓ of the world’s mass shooting took place in US.
This prompted me to think if I could find a classification model that can identify the cities that are more prone to such attacks so potential prevention methods can be taken.
Data Source and size
I obtained my data from the following 3 sources:
- Mass shooting list for past 50 years on Kaggle: https://www.kaggle.com/zusmani/us-mass-shootings-last-50-years/data.
- Crime information published by Federal Bureau of Investigation (FBI) from 1985 to 2014: Uniform Crime Reporting Statistics (https://www.ucrdatatool.gov/Search/Crime/Local/).
-
Firearm law details by state from 1991 to 2017: https://www.statefirearmlaws.org
- Cleaned Data Size:
I first cleaned individual tables and then utilized AWS and Postgres to merge the tables so it would be ready for modeling. After removing the nulls, I ended up having 74,483 data points (out of which 94 had mass shooting occurred). Each data point contain feature information about one city for one specific year (e.g., features about Seattle, WA for the year of 2011).
- These feature information include:
- Number of Violent Crime occurred this year
- Violent Crime Rate (Number of Crime per 100k population)
- Population
- State Firearm law details for that year (e.g., whether a specific regulation is in place that year)
- Total number of State Firearm Laws in place that year.
Modeling Results
After trying different classification models include KNN, Random Forest, Logistic Regression, Naive Bayes, SVM, Gradient Boosting and Ada Boosting, I found Ada Boosting gave me the best & most consistent results. Below shows the ROC of the test set (0.3 train/test split).
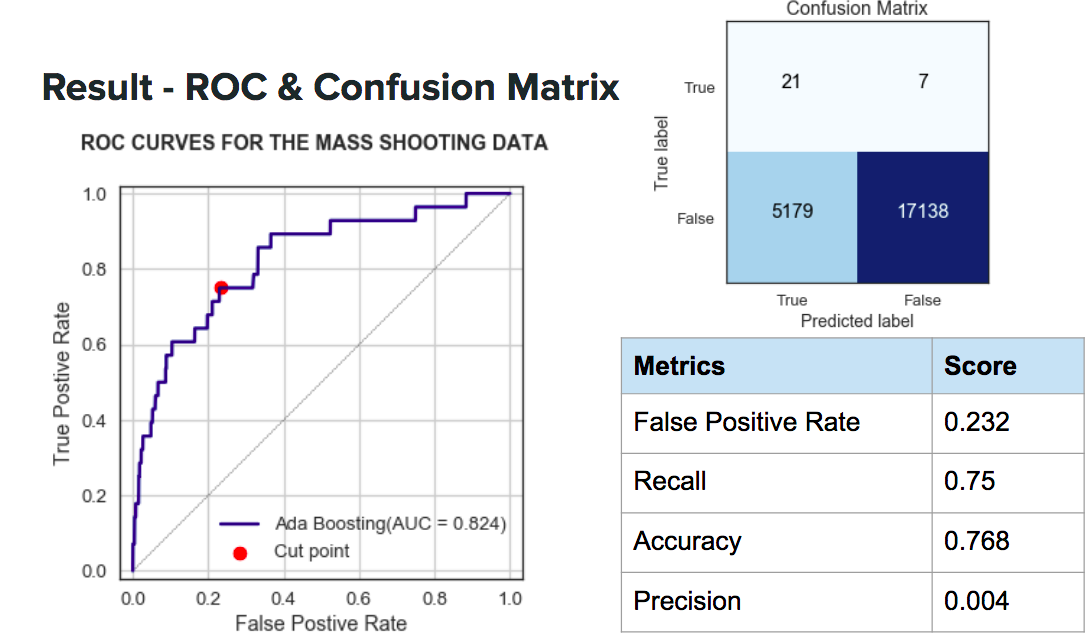 As you can see the AUC is 0.824. Since my data is so biased(only 0.1% of data point is True), The orginal prediction model output from scikit learn pretty much is guessing every city as not having a mass shooting event. :(
That’s not gonna help me find the high risk cities.
So along the ROC curve, I picked a cut point that provides a reasonable balance between the false positive rate and the true positive rate. This way, I will be able to identify 75% of the cities that actually had a mass shooting occurred.
As you can see the AUC is 0.824. Since my data is so biased(only 0.1% of data point is True), The orginal prediction model output from scikit learn pretty much is guessing every city as not having a mass shooting event. :(
That’s not gonna help me find the high risk cities.
So along the ROC curve, I picked a cut point that provides a reasonable balance between the false positive rate and the true positive rate. This way, I will be able to identify 75% of the cities that actually had a mass shooting occurred.
Findings
-
Top Features
In this model, the top predictors based on feature importances are Population (importance = 0.32), Crime rate (0.21), Crime Number (0.18) and Total Number of Firearm laws (0.06). To see how these feature impact the risk of mass shooting occurance, I randomly selected a data point, fix the value of all the other feature and only change the feature in concern. Then I put the data point with modified features into the model, and stored the y proba. Last, for easier explaination, I have scaled the y proba and turn it into a risk score from 0 to 100 (The model will flag the data point as mass shooting had occurred when risk score reaches above 88.4). Below are the plots for these features that I looked at.
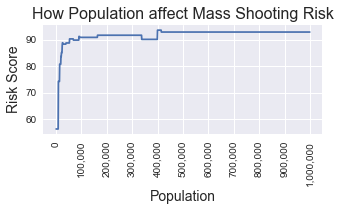
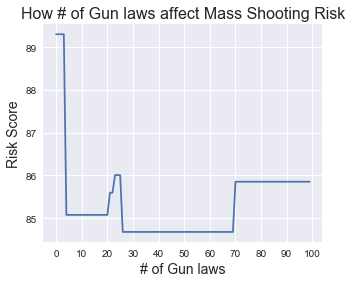
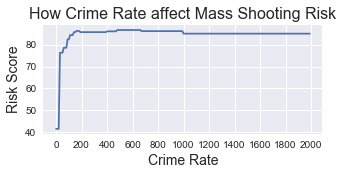
As you can see, as population increase, the risk score increase but soon reached a plateau around 100,000 people. Similar pattern is observed for crime rate. Total # of Firearm laws doesn’t seem to have a great effect on the risk score. As the # of the gun laws increase, the risk first dropped and for some reason jump back later on. I will look into this more closely in the future.
-
Top Firearm Laws Predictors
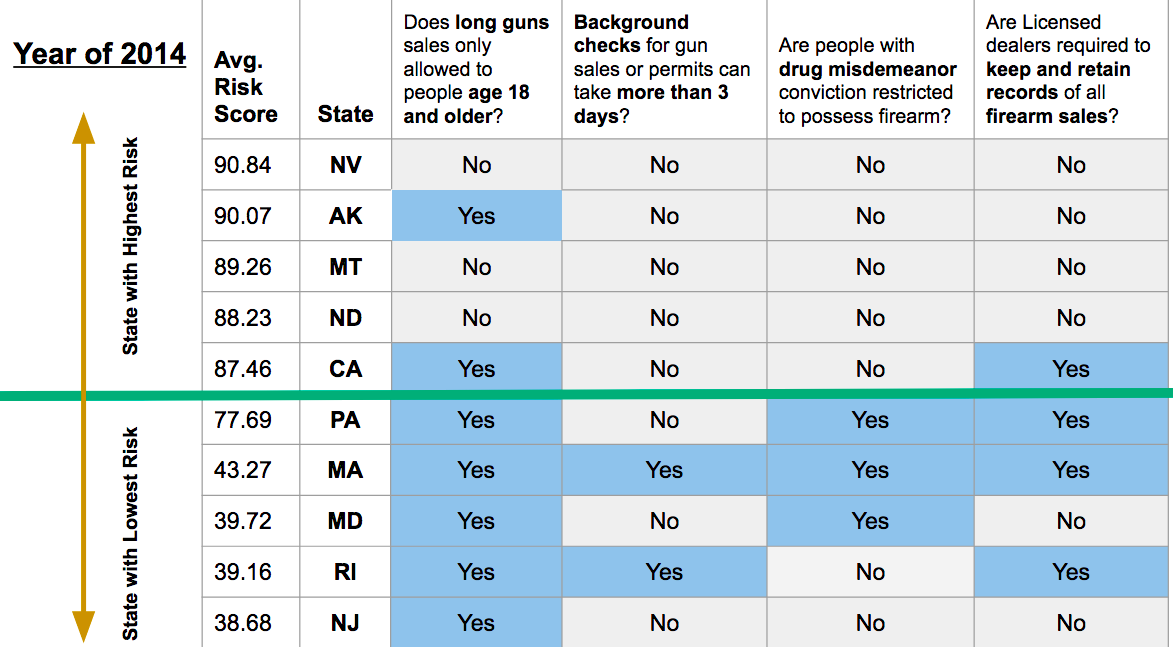
After that, I identified the top 4 laws predictor based on feature importance. And made the table below to show in the year of 2014 whether these laws were in place for the most/least risky state. As you could see there is a slight tendency that the presence of law decrease the risk of having mass shootings.
-
Top/Bottom Risky Cities
Last, I pull my full dataset into the model, and get the y proba for all the data points. Below shows the histogram of the y proba.
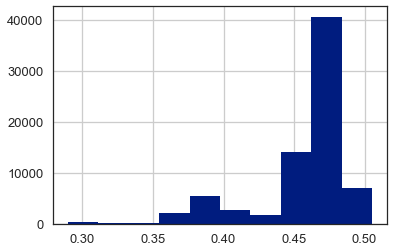
I did the scaling again from y proba to risk score, and took the average for each cities and came up with the top/bottom risky cities in the US.
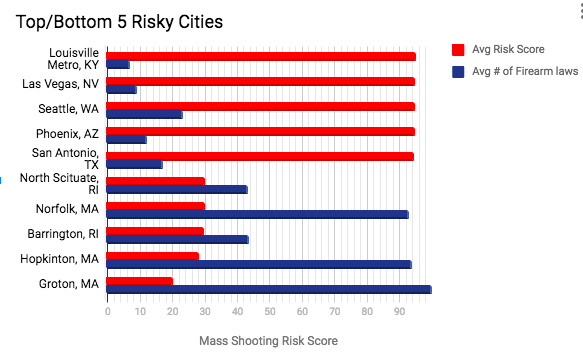
Population:
Top 5 cities range from 575k to 1.6 million.
Bottom 5 cities range from 10k to 16k.
Crime Rate:
Top 5 cities range from 603 to 867.
Bottom 5 cities range from 34 to 50.
The stats and chart does correspond to the findings I had earlier for the features.
Future Works
If I have additional time, I would like to first further refine my model by trying under-sampling & ensambling different models. I would also try to collect more data and incorporate more features.